
As we near the end of 2021, it’s time for a wrap-up post on Interconnected.
We wrote a similar post last year in “Open Source, Open Stats, Open Development”, where we provided a rough breakdown of our audience. We also shared details and learnings about our “open source first” tech stack built on Ghost.org, which has not changed much.
Here’s a similar breakdown for 2021.
Top 15 Geographies

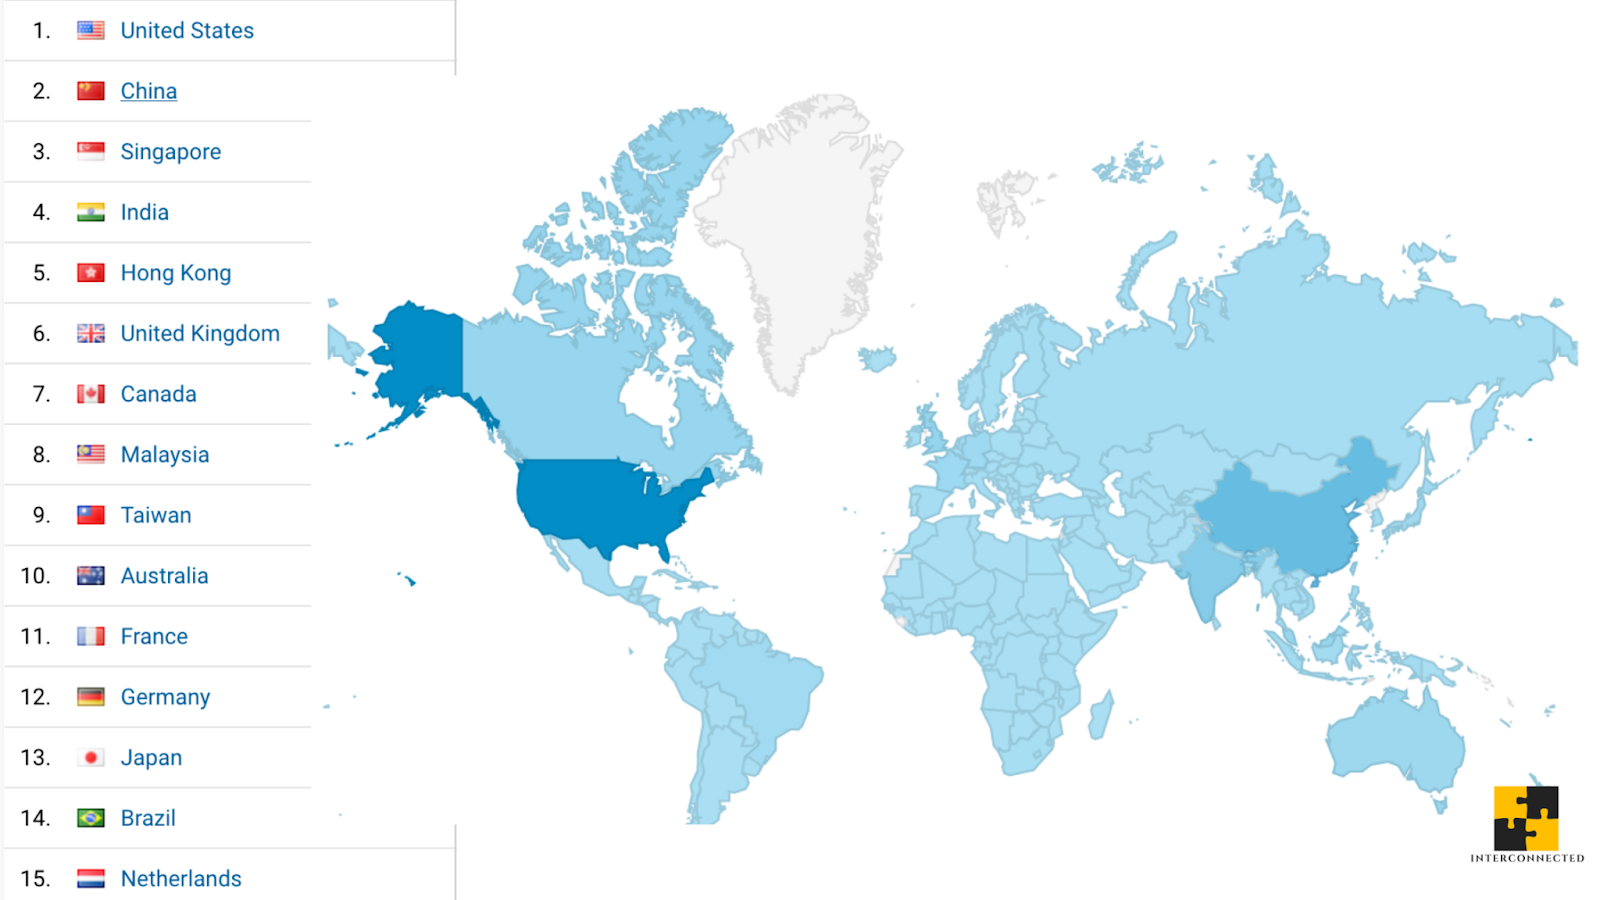
Below are the top 15 geographical locations of readership in 2021 with proportional percentages:
- US (28%)
- China (12%)
- Singapore (7%)
- India (6%)
- Hong Kong (4%)
- UK (3%)
- Canada (3%)
- Malaysia (3%)
- Taiwan (2%)
- Australia (2%)
- France (2%)
- Germany (2%)
- Japan (2%)
- Brazil (1%)
- Netherlands (1%)
One interesting evolution from last year’s breakdown is a more evenly distributed readership. The top two locations from last year were the US (~45%) followed by China (~10%), while other geographies were negligible. Now, we have meaningful readership from Singapore, India, the UK, and many other places.
This more even distribution speaks to the mission of Interconnected, where we try to break down and analyze the underlying connections between different industries, markets, and trends of innovation across geographies. That’s why our top three category tags are: Open Source, Cloud Industry, Developer – all global topics. I’m also glad to see our readership reaching almost full coverage in Africa, except for Sierra Leone and Western Sahara (technically a disputed territory mostly administered by Morocco).
Top 15 Articles
Here’s the list of our top 15 articles in 2021 by traffic.
- Jack Ma's Bund Finance Summit Speech (one of our few trilingual articles, available in English, Chinese, and Japanese)
- Zhang Yiming’s Last Speech
- Low Code No Code, Part II: How to Ride This Wave
- RISC-V, China, Nightingales
- Low Code No Code, Part I: Use Cases and Landscape
- Why Is Facebook Not in the Cloud Business?
- China's “Semiconductor Theranos”: HSMC
- What Does Agora ($API) Do?
- Morris Chang, Global Semiconductor Competition, Make “Making Stuff” Cool
- Zhang Yiming's Resignation
- What Does Databricks Do?
- Is “ByteDance Cloud” A Good Idea?
- Can the US “Out China” China?
- Morris Chang's Last Speech
- Distributed Engineering Management Best Practices with Justin Cormack
Some of these articles were published in 2020, so it’s satisfying to see high-quality but relatively old posts continue to do well. I’m also seeing a strong demand for translation-type posts of speeches or other types of primary source information to further “unlock” the Chinese tech world.
Our team will take a break from publishing in the next two weeks to reflect on the stats we just shared with you in this post, and the meaning behind them. We will share more of our future plans in our first post of 2022. Until then, happy holidays, happy New Year, and thank you for your ongoing support!
2021 《互联》总结:读者数据和分类
随着2021年接近尾声,是时候对《互联》写一篇总结性的文章了。
我们去年也写了一篇类似的文章《开源、开放数据、开放开发》,分享了一些与我们读者有关的粗略数据和分类。文章里还分享了关于我们用“开源第一”的方式,在Ghost.org上搭建此博客的技术栈的细节和经验,这方面在过去一年里没有发生太大变化。
以下是2021年的总结和有关数据及分类。
排名前15的读者来源地域
以下是2021年读者数量最多的15个地域,并附有比例百分比。
- 美国 (28%)
- 中国 (12%)
- 新加坡 (7%)
- 印度 (6%)
- 香港 (4%)
- 英国 (3%)
- 加拿大 (3%)
- 马来西亚 (3%)
- 台湾 (2%)
- 澳大利亚 (2%)
- 法国 (2%)
- 德国 (2%)
- 日本 (2%)
- 巴西 (1%)
- 荷兰(1%)
与去年相比,一个有趣的演变是读者地理分布更均匀了。去年排名前两位的地区是美国(约45%),其次是中国(约10%),其他地区的比例可以忽略不计。现在,我们有来自新加坡、印度、英国和许多其他地方的读者群。
这种更均衡的分布证明了《互联》的使命,也就是试图分解和分析不同行业、市场和跨地域创新趋势之间的潜在联系。这也是为什么网站上所有文章的前三个类别标签是:开源、云行业、开发者 – 都是全球范围的话题。我也很高兴看到《互联》的读者群几乎覆盖了全非洲,除了塞拉利昂和西撒哈拉(理论上说它是一个主要由摩洛哥管理的“争议领土”)。
排名前15的文章
以下是我们2021年按流量排名的前15篇文章:
- 《马云上海外滩金融峰会上的演讲 》(《互联》上少有的“三语文章”,有英文,中文和日文版)
- 《张一鸣的最后一次演讲》
- 《Low Code No Code第二篇:怎么冲这股热潮》
- 《RISC-V,中国,夜莺》
- 《Low Code No Code第一篇:使用场景和景观》
- 《为什么Facebook不做云的生意?》
- 《中国的 "半导体Theranos":弘芯》
- 《声网到底是做啥的?》
- 《张忠谋,全局半导体竞争,怎么让“造东西”更酷》
- 《张一鸣辞职》
- 《Databricks是做什么的?》
- 《做“字节云”是个好主意吗?》
- 《美国能否"比中国更中国"?》
- 《张忠谋的最后一次演讲》
- 《分布式工程团队管理的最佳实践》
其中一些文章是在去年发表的,能看到高质量但相对久一点的文章继续表现良好很欣慰。同时我也看到对演讲稿或其他类型的原始信息的翻译类文章的读者需求,以进一步帮助西方读者“解密”中国科技界。
《互联》团队将休息两周,暂停发布新文章,以反思我们在这篇文章中与大家分享的数据的意义。我们将在2022年的第一篇文章中分享更多未来的计划。在此先祝所有读者节日快乐,新年快乐,感谢您一直以来的支持!
如果您喜欢所读的内容,请用email订阅加入“互联”。要想读以前的文章,请查阅《互联档案》。每周一篇新文章送达您的邮箱。请在Twitter、LinkedIn、Clubhouse(@kevinsxu)上给个follow,和我交流互动!